City-scale Shadow Casting
GENERAL INFORMATION

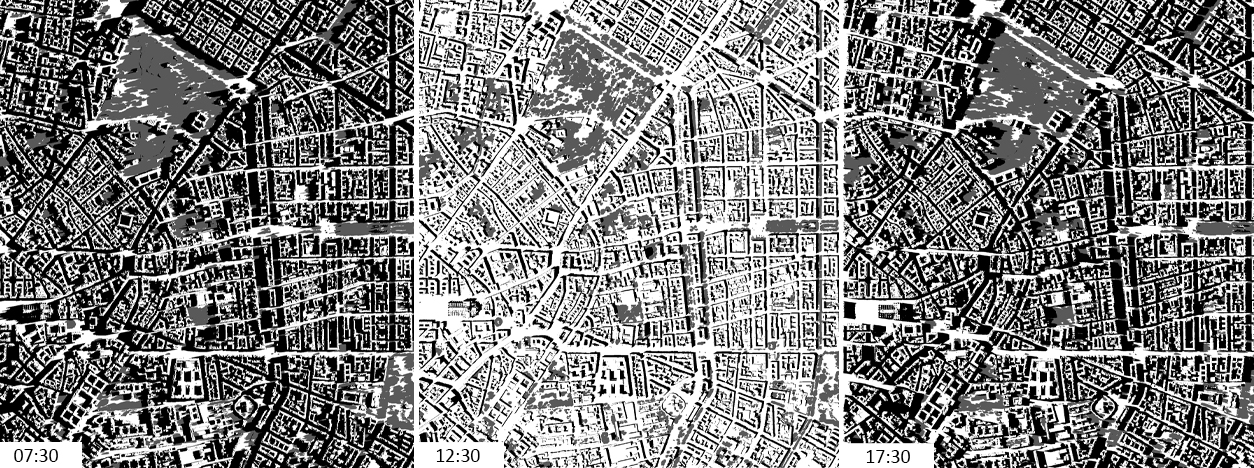
Shadow casting is a fundamental analytical approach in urban climatology, solar energy assessment, and architectural design. It quantifies how built and natural elements, such as buildings, terrain, and vegetation (trees) obstruct direct solar radiation over time. By simulating the sun’s path and the resulting cast shadows at various hours and dates, practitioners gain insights into sunlight availability, shading performance, and microclimatic patterns across urban or architectural contexts.
Shadows are inherently geometric: at any given time t, the sun’s position is defined by its solar altitude and azimuth angles. Casting objects project a region of masking onto receivers (ground, façades, roofs), forming a shadow mask that evolves continuously. Shadow modelling thus combines spatial data (3D geometry) with temporal data (solar ephemeris) to produce time‐resolved maps of shading extent and duration.
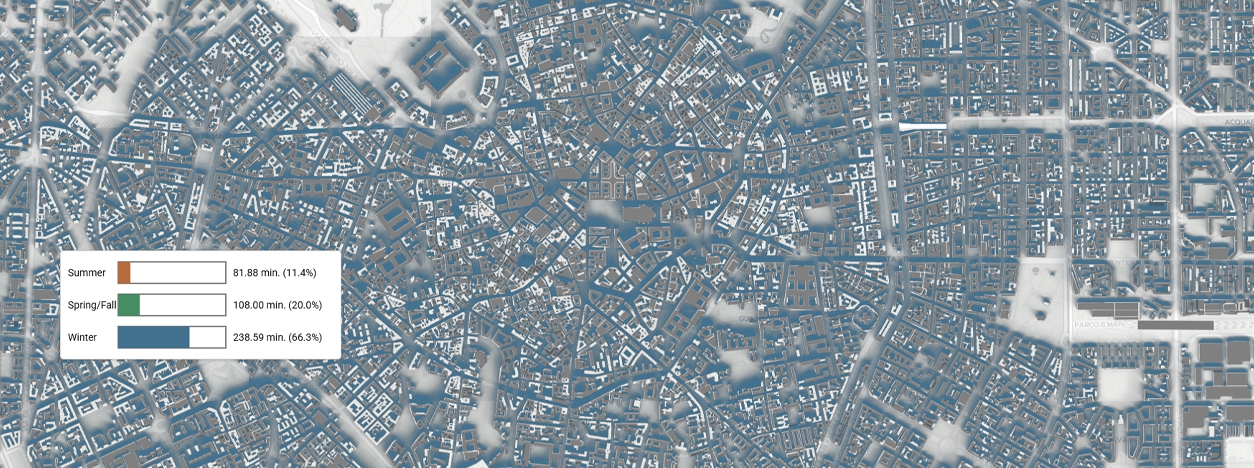
Shadow casting is dimensionless. It is often represented as binary (shadow/no shadow) or as cumulative shadow hours over time.
Applications span from large‐scale urban planning, assessing annual shadow footprints on public parks, to façade‐level solar access studies and daylight autonomy analyses. Shadow models support decisions on building placement, façade design, public space comfort, and renewable energy siting. For instance, dense urban areas with tall buildings may cast extensive shadows, reducing solar access for ground-level spaces, while open areas allow more sunlight penetration. By analyzing shadow patterns, planners can optimize building designs for energy efficiency, enhance pedestrian comfort, and ensure equitable access to daylight in public spaces.
Key parameters include:
- Solar Geometry: computed via astronomical formulas for date, time, and geographic coordinates.
- Obstructor Geometry: represented as 2.5D (e.g., DSM) or full 3D mesh, encompassing buildings, trees, and terrain.
- Receiver Grid: the set of points or surfaces where shadow metrics (e.g., duration, frequency, irradiance reduction) are evaluated.
SHADOW CASTING AND THERMAL COMFORT
Shading profoundly influences microclimate and thermal comfort by modulating solar gains:
- Daytime Cooling. Shaded areas reduce direct shortwave radiation, lowering surface and air temperatures. In street canyons or plazas, computed shadow metrics help identify possible “thermal refuges” or “cool islands” during peak insolation, guiding the placement of seating, vegetation, or pergolas.
- Nighttime Radiative Cooling. Conversely, shading can inhibit longwave radiative cooling at night by obstructing clear-sky radiation from escaping to the atmosphere. However, from a thermal comfort perspective in urban environments, the difference between shaded and unshaded areas becomes less critical at night.
- Energy Balance Impacts. On building façades and roofs, shading directly alters heating and cooling loads. Shadow modelling informs energy simulations by providing time‐series of incident irradiance reduction, improving Heating, Ventilation, and Air Conditioning (HVAC) sizing and renewable integration strategies.
- Air Quality and Ventilation. Extended shading often correlates with reduced sky exposure and can affect convective currents. Coupling shadow outputs with CFD or wind‐flow models elucidates zones of potential pollutant trapping.
Factors Affecting Shadow Impact and Thermal Comfort:
- Building Height and Density. Taller, denser buildings create longer shadows—reducing heat stress in summer but increasing heating needs in winter.
- Urban Geometry. Narrow canyons, in any orientation, trap shadows, cooling areas in summer but risking overcooling in winter.
- Seasonal and Diurnal Variations. Shadows shift with the sun’s altitude and azimuth, requiring dynamic modelling across seasons and times of day. Winter’s longer shadows can cause cold stress, while summer’s shadows help with cooling. Design must respond to these seasonal shifts.
- Surface Reflectivity. Light-colored surfaces reflect solar radiation, indirectly affecting shaded areas through reflected light.
MEASURE AND MODELLING
Shadow casting is modelled using GIS-based tools for large-scale analyses and 3D parametric software like Rhino-Grasshopper (for instance) for detailed architectural simulations.
GIS-Based Modelling. GIS tools leverage spatial data to simulate shadows at city scale.
Process:
- Data Integration: Import 3D building models, terrain data (DEM/DSM), and land use maps.
- Solar Position Calculation: Compute sun angles (altitude/azimuth) for specific dates/times using astronomical algorithms.
- Shadow Projection: Apply ray-tracing or raster-based methods to project shadows from obstructions (buildings, trees).
- Cumulative Analysis: Aggregate shadows over time (e.g., annual solar access) using scripts or plugins.
Example Tools:
- ArcGIS Solar Analyst: Generates shadow maps and duration tables.
- QGIS Shadow Plugin, including UMEP: Open-source tool for static and dynamic shadow simulations.
- GRASS r.sun: Models solar radiation and shadows in raster format.
Advantages:
- Scalable for city-wide analyses.
- Integrates with urban planning datasets (zoning, infrastructure).
3D Parametric Modelling (Rhino-Grasshopper). Rhino-Grasshopper (among others) enables precise, dynamic shadow simulations using parametric design.
Process:
- 3D Model Preparation: Import or create 3D geometry of buildings and terrain.
- Sun Path Configuration: Use plugins like Ladybug to set location, date, and time.
- Shadow Simulation: Generate real-time shadow geometry.
- Parametric Optimization: Adjust building massing/orientation to minimize adverse shading.
Example Tools:
- Ladybug: Visualizes sun paths and calculates solar radiation.
Advantages:
- High precision for architectural design.
- Dynamic feedback for iterative design processes.
MAIN APPLICATIONS

Shadow analysis plays a critical role in urban planning, architecture, and environmental design. By modeling the way shadows interact with the built environment across different times of day and seasons, designers and planners can make informed decisions that enhance sustainability, comfort, and regulatory compliance. The following are key application areas where shadow analysis delivers practical and strategic value:
- Urban Heat Island Mitigation: Mapping daytime shadow patterns informs urban greening, high-albedo surface placement, and shading interventions to reduce peak temperatures.
- Pedestrian Comfort Planning: Comfort: In warmer climates, shadow analysis enables the design of shaded walkways to improve thermal comfort, while in colder seasons, it helps ensure that public plazas receive adequate winter sunlight.
- Solar Energy Optimization: Shadow modelling supports the identification of optimal sites for solar panels by avoiding shaded areas and informs the planning of community solar farms through cumulative shadow mapping.
- Architectural Design: Building orientation can be optimized for passive solar heating and cooling, and façade design is refined to strike a balance between daylighting and glare control.
- Parametric Design Iterations: Leveraging Grasshopper-based workflows to iterate tower forms, façade louvers, and pergola geometries, balancing daylight admission with shading needs.
- Regulatory Compliance & Zoning: Producing shadow impact assessments for planning approvals, demonstrating compliance with local ordinances on shadow incursion into adjacent properties or public spaces.
RELATED LINKS AND ADDITIONAL RESOURCES
- Ladybug Tools: An open-source environmental plugin suite for Rhino and Grasshopper, widely used for solar radiation and shadow analysis in architectural and urban design.
- GRASS GIS – r.sun Module: A GIS-based tool for simulating solar irradiance and shadow patterns over complex terrains using raster data.
- UMEP – Daily Shadow Pattern Processor: A plugin within the Urban Multi-scale Environmental Predictor (UMEP) suite for QGIS, enabling the calculation and visualization of daily shadow patterns for urban climate and solar studies.
- Big Data for Urban Shadow Analysis: This paper proposes using high-resolution airborne laser scanning point clouds and the Comprehensive Urban Shadow algorithm.
- Actual and experiential shadow origin tagging: A 2.5D algorithm efficiently identifies and classifies shadow sources, applying a raster method to model shadows in architectural and urban environments.
- Deep Umbra: a generative adversarial network to compute high-resolution sunlight access and shadows in urban areas, trained on data from seven cities and extendable globally.
- Deep Umbra Shadow Visualizations: An interactive platform for exploring the effects of building shadows on urban spaces throughout the day and year.
- UIC Shadow Map Tool: A web-based tool from the University of Illinois at Chicago for generating and analyzing shadow maps in urban contexts.
- ShadeMap – Real-Time Sun and Shadow Visualization: This interactive tool visualizes how sunlight and shadows move across a specific location over time, helping users plan for shade, sun exposure, or photography based on building heights and terrain.
*Images from

