MODIS MISSION
GENERAL INFORMATION

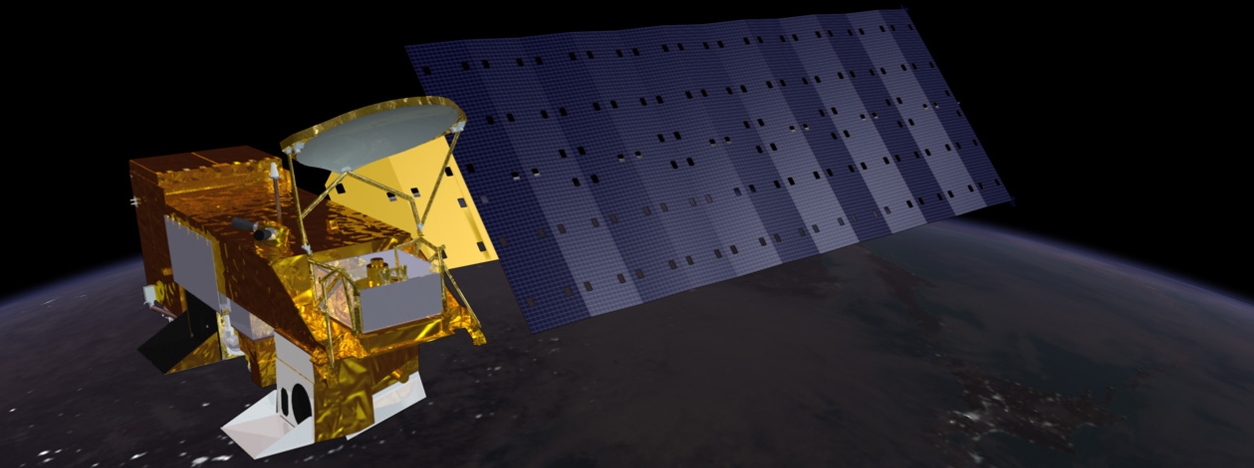
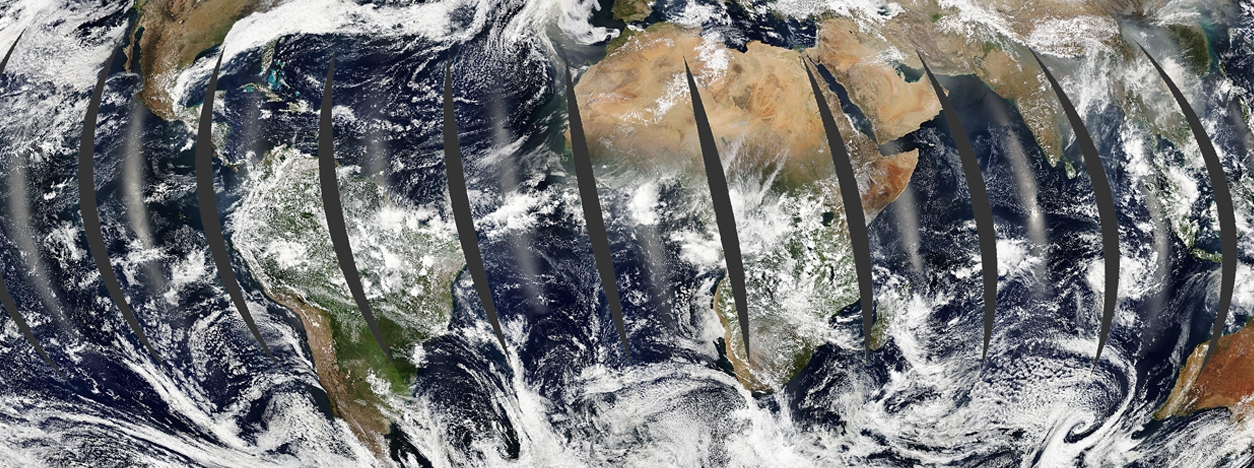
The Moderate Resolution Imaging Spectroradiometer (MODIS) is a remote sensing instrument developed by NASA and launched onboard the Terra satellite in 1999, followed by the Aqua satellite in 2002. With its 36 spectral bands, MODIS provides comprehensive global coverage of the Earth’s surface every 1 to 2 days, capturing data across the visible, near-infrared, and thermal infrared ranges of the electromagnetic spectrum.
MODIS data plays a crucial role in various scientific endeavors, including land cover mapping, vegetation monitoring, atmospheric studies, oceanic observations, and climate change research. Its high temporal resolution allows for the continuous monitoring of dynamic processes and changes occurring on the Earth’s surface over time.
This mission represents a collaborative effort between NASA, international partners, the United States Geological Survey (USGS), and the National Oceanic and Atmospheric Administration (NOAA). Through this collaboration, MODIS contributes valuable data to scientific research, operational applications, and decision-making processes.
By leveraging the capabilities of MODIS, scientists and researchers gain access to high-resolution data with global coverage, enabling them to study and understand various Earth system processes. These applications span across climate studies, land cover mapping, vegetation monitoring, and numerous other areas of scientific investigation.
In summary, the Moderate Resolution Imaging Spectroradiometer (MODIS) is an essential instrument carried by NASA’s Terra and Aqua satellites. Its extensive spectral coverage and high temporal resolution make it a valuable tool for studying and monitoring the Earth’s land, ocean, and atmospheric properties. Through collaborative efforts, MODIS provides valuable data for scientific research, operational applications, and decision-making processes, contributing to our understanding of the planet and its dynamic systems.
The MODIS instrument captures data in 36 spectral bands, providing information about various Earth surface and atmospheric properties through different derived products such as (among others):
| MODIS Product | Spectral Bands | Spatial Resolution | Temporal Resolution |
| Normalized Difference Vegetation Index (NDVI) | Red (620-670 nm), Near-Infrared (841-876 nm) | 250 meters (MODIS) or 500 meters (MODIS-NDVI) | Daily |
| Enhanced Vegetation Index (EVI) | Blue, Red, Near-Infrared | 250 meters (MODIS) | Daily |
| Land Surface Temperature (LST) | Thermal Infrared | 1 kilometer (LST Daytime), 1 kilometer (LST Nighttime) | Daily |
| Evapotranspiration (ET) | Shortwave Infrared, Thermal Infrared | 1 kilometer | 8-day composite |
| Aerosol Optical Depth (AOD) | Visible, Near-Infrared | 10 kilometers | Daily |
TECHNICAL DETAILS
The MODIS instrument is deployed on two satellites: Terra and Aqua. These satellites provide complementary observations and enhance the coverage and temporal resolution of MODIS data.
Primary Sensor: Terra MODIS
Number of Bands: 36
Spatial Resolution: 250 meters (bands 1-2); 500 meters (bands 3-7); 1000 meters (bands 8-36)
Radiometric Resolution: 12-bit (Visible and Shortwave Infrared); 14-bit (Thermal Infrared)
Spectral Range:
- Bands 1-2: 0.62-0.88 µm
- Bands 3-7: 0.41-2.1 µm
- Bands 8-19: 3.66-15.5 µm
- Bands 20-36: 0.62-14.4 µm Temporal Resolution: 1-2 days
Primary Sensor: Aqua MODIS
Number of Bands: 36
Spatial Resolution: 250 meters (bands 1-2); 500 meters (bands 3-7); 1000 meters (bands 8-36)
Radiometric Resolution: 12-bit (Visible and Shortwave Infrared); 14-bit (Thermal Infrared)
Spectral Range:
- Bands 1-2: 0.62-0.88 µm
- Bands 3-7: 0.41-2.1 µm
- Bands 8-19: 3.66-15.5 µm
- Bands 20-36: 0.62-14.4 µm Temporal Resolution: 1-2 days
The Terra and Aqua satellites, each equipped with MODIS, ensure comprehensive global observations of the Earth’s land, ocean, and atmospheric properties. Their synchronized data acquisition enables researchers and scientists to study a wide range of phenomena and processes occurring on our planet.
Here are the technical details of the bands for MODIS on both missions:
| Band | Name | Spectral Range (µm) | Band | Name | Spectral Range (µm) |
| 1 | Visible | 0.62-0.67 | 20 | Thermal Infrared | 3.660-3.840 |
| 2 | Visible | 0.841-0.876 | 21 | Thermal Infrared | 3.929-3.989 |
| 3 | Visible | 0.459-0.479 | 22 | Thermal Infrared | 3.929-3.989 |
| 4 | Visible | 0.545-0.565 | 23 | Thermal Infrared | 4.020-4.080 |
| 5 | Visible | 1.230-1.250 | 24 | Thermal Infrared | 4.433-4.498 |
| 6 | Visible | 1.628-1.652 | 25 | Thermal Infrared | 4.482-4.549 |
| 7 | Shortwave Infrared | 2.105-2.155 | 26 | Thermal Infrared | 1.360-1.390 |
| 8 | Shortwave Infrared | 0.405-0.420 | 27 | Thermal Infrared | 6.535-6.895 |
| 9 | Shortwave Infrared | 0.438-0.448 | 28 | Thermal Infrared | 7.175-7.475 |
| 10 | Shortwave Infrared | 0.483-0.493 | 29 | Thermal Infrared | 8.400-8.700 |
| 11 | Shortwave Infrared | 0.526-0.536 | 30 | Thermal Infrared | 9.580-9.880 |
| 12 | Shortwave Infrared | 0.546-0.556 | 31 | Thermal Infrared | 10.780-11.280 |
| 13 | Shortwave Infrared | 0.662-0.672 | 32 | Thermal Infrared | 11.770-12.270 |
| 14 | Shortwave Infrared | 0.673-0.683 | 33 | Thermal Infrared | 13.185-13.485 |
| 15 | Shortwave Infrared | 0.743-0.753 | 34 | Thermal Infrared | 13.485-13.785 |
| 16 | Shortwave Infrared | 0.862-0.877 | 35 | Thermal Infrared | 13.785-14.085 |
| 17 | Shortwave Infrared | 0.890-0.920 | 36 | Thermal Infrared | 14.085-14.385 |
| 18 | Shortwave Infrared | 0.931-0.941 | |||
| 19 | Shortwave Infrared | 0.915-0.965 |
MAIN APPLICATIONS AND DATA ACCESS

MODIS data is widely used for various applications due to its global coverage and frequent observations. Some of the main applications of MODIS data include:
- Land cover mapping and classification
- Vegetation monitoring and assessment
- Atmospheric studies and aerosol monitoring
- Oceanic observations and sea surface temperature monitoring
- Climate change research and analysis
Additionally, MODIS data also contributes to a range of land and water application areas including wildfire monitoring, temperature and emissivity changes, land surface change, vegetation and ecosystem dynamics, natural disasters, and agriculture studies.
MODIS data can be accessed through several sources. MODIS Level 1 and atmosphere products are available through the LAADS web. Land Products are available through the Land Processes DAAC at the U. S. Geological Survey EROS Data Center (EDC). Cryosphere data products (snow and sea ice cover) are available from the National Snow and Ice Data Center (NSIDC) in Boulder, Colorado. Ocean color products and sea surface temperature products along with information about these products are obtainable at the OCDPS at GSFC.
RELATED LINKS AND ADDITIONAL RESOURCES
Further background information about MODIS:
- LP DAAC – MODIS Overview – USGS – This page provides an overview of the MODIS instrument and its operations on both the Terra and Aqua spacecraft.
- MODIS | Terra – This page provides information on the MODIS sensor on board the Terra satellite and its capabilities.
- MODIS | Aqua Project Science – This page provides information on the MODIS sensor on board the Aqua satellite and its capabilities.
- MODIS Brochure – This is a brochure that provides an overview of the MODIS mission and its capabilities.
Accessing, downloading, and working with MODIS data:
- USGS EarthExplorer– This is the main portal for searching and downloading Landsat data. It allows users to search for and download data by location, date range, and other criteria.
- MODIS | Earthdata – This page provides information on how to access MODIS data products in real-time and near real-time.
- Data – MODIS Web – This page provides detailed information on how MODIS data is collected, processed, and distributed. It also includes links to various sources where you can access and download MODIS data products.
- Find and Download MODIS Data From the USGS Earth Explorer Website – This tutorial provides step-by-step instructions on how to find and download MODIS data from the USGS Earth Explorer website.
*Images from

