Thermographic Imagery
GENERAL INFORMATION

Thermographic imagery, captured via infrared thermal cameras, is a critical technology for visualizing and analyzing surface temperature distributions in urban environments.
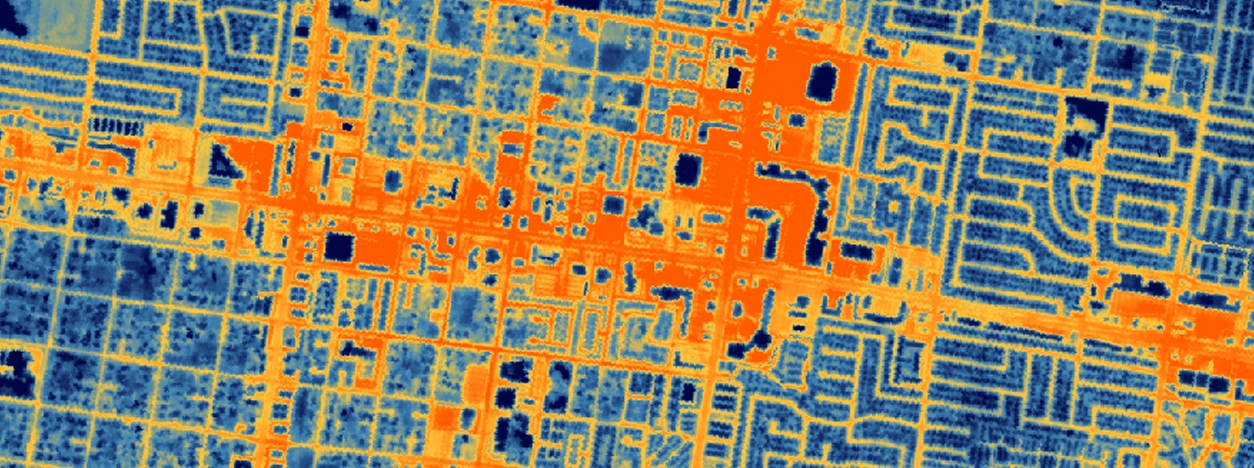
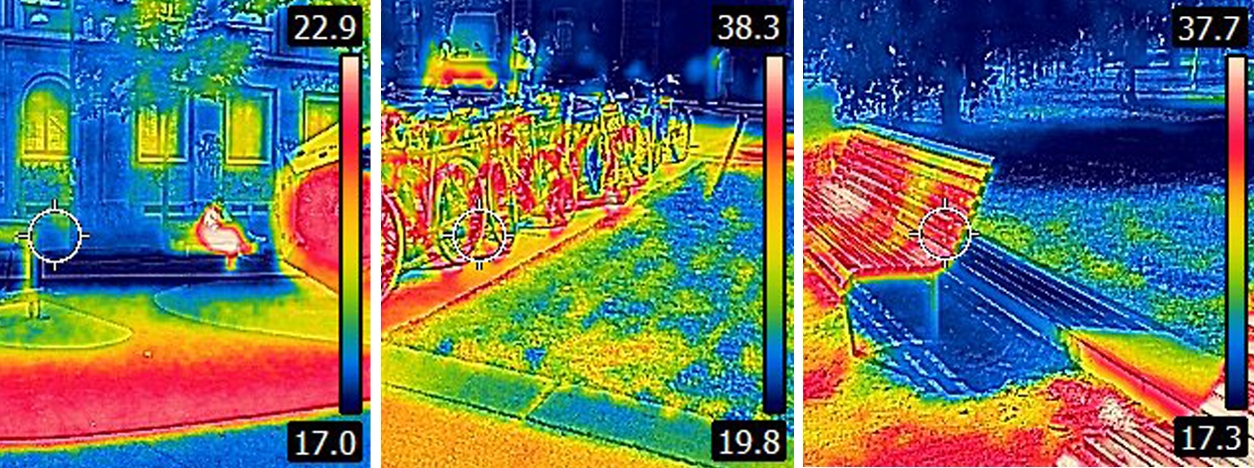
Thermographic imagery, or thermal imaging, refers to the acquisition and interpretation of surface temperature distributions using thermal infrared (TIR) sensors. These sensors detect longwave infrared radiation (IR), typically 7–14 µm wavelength, emitted by all objects based on their temperature, and translate it into thermal maps or images where colors represent temperature variations.
Unlike solar radiation instruments that quantify incoming energy, thermal cameras passively record emitted energy, enabling visualization of thermal patterns across natural and built environments. In particular, thermographic data reveals emitted radiation, making it directly relevant for analyzing surface heat retention, heat loss, and thermal heterogeneity.
Key concepts include:
- Thermal Radiation: All objects emit IR radiation proportional to their temperature (governed by the Stefan-Boltzmann Law).
- Emissivity: The efficiency of a surface in emitting thermal radiation (e.g., asphalt: ~0.95, glass: ~0.85).
- Surface Temperature: Measured in °C or K, critical for assessing heat exchange between buildings, pavements, vegetation, and the atmosphere.
Thermographic imagery is pivotal in urban climatology for diagnosing heat islands, optimizing energy efficiency, and enhancing outdoor thermal comfort. By capturing surface temperature variations, it assesses land surface temperature (LST), pinpoints heat-retaining materials and evaluates surface energy balance dynamics. This technology exposes fine-scale thermal heterogeneity driven by factors such as building materials, urban geometry, and vegetation distribution. Applications span critical domains including building diagnostics (e.g., insulation flaws), urban design (e.g., heat mitigation strategies), and climate resilience planning (e.g., adaptive cooling interventions), solidifying its role as an indispensable tool for sustainable urban development.
In summary, thermography is used to:
- Assess surface temperatures of urban materials (e.g., asphalt, concrete, vegetation).
- Detect spatial patterns of heat accumulation and dissipation.
- Quantify the impact of surface materials, vegetation, and geometry on urban heat dynamics.
Types of thermal imagery platforms include:
- Ground-based infrared cameras: High-resolution, site-specific observations.
- Aerial/satellite platforms (e.g., Landsat TIRS, ECOSTRESS, Sentinel-3 SLSTR): Broad-scale, repeated coverage for temporal and spatial analysis.
- Drone-mounted systems (UAVs): Intermediate scale with flexibility and fine detail.
Temperature readings from thermal cameras must be interpreted with care, accounting for emissivity variations, atmospheric effects, and view geometry. When appropriately calibrated and corrected, thermal data supports evidence-based urban design and planning.
THERMAL IMAGERY AND URBAN CLIMATE
Thermal imagery provides critical insights into surface thermal behavior, influencing human comfort, urban energy demand, and heat stress exposure. Thermal imaging provides a spatially explicit view of how heat is stored and radiated by urban surfaces, critically informing urban climate studies. Key Urban Applications of Thermographic Data include:
- Urban Heat Island (UHI) Mapping: Identifies localized thermal hotspots (e.g., rooftops, paved surfaces) that contribute to elevated day and nighttime temperatures.
- Surface Heat Mapping: Identifies thermally vulnerable zones such as asphalt lots, rooftops, and sparse vegetation areas.
- Thermal Comfort Mapping: Combined with microclimate models to assess radiant heat exposure and pedestrian thermal stress.
- Material Performance Analysis: Evaluates thermal performance of construction materials (e.g., cool roofs, reflective pavements).
- Cool Surface Evaluation: Monitors performance of high-albedo coatings, green roofs, and reflective pavements in real-world conditions.
- Microclimate Zoning: Enables fine-scale thermal zoning for resilient design of outdoor spaces.
Urban vegetation, shading structures, surface albedo, and built form all influence surface temperature, and thermography helps visualize their thermal performance in real-world conditions.
Urban Factors Influencing Thermal Patterns:
- Surface Materials: Low-albedo, high-thermal-mass surfaces retain and re-radiate heat, elevating nighttime LST.
- Urban Geometry: Canyon-like forms trap heat; orientations influence diurnal heating.
- Vegetation and Water: Provide evaporative cooling, resulting in thermal “cold spots.”
- Temporal Dynamics: Day/night imagery reveals heat retention patterns and surface cooling behavior.
MEASUREMENT METHODS AND TOOLS
Thermographic data can be obtained using a range of instruments and platforms:
- Handheld Thermal Cameras (e.g., FLIR, Testo): Provide high-resolution thermal maps for façade assessments, pavement surveys, and energy audits.
- Drone-mounted Thermal Sensors: Enable rapid coverage of urban blocks for microclimate analysis and building energy diagnostics.
- Airborne and Satellite TIR Sensors (e.g., Landsat 8 TIRS, ECOSTRESS, ASTER, SatVU): Provide periodic thermal maps at city to regional scales.
Post-processing tools convert radiance data into calibrated surface temperature maps, often corrected for emissivity and atmospheric effects. Thermal imagery can be integrated with 3D urban models or GIS systems to enhance spatial analysis.
In particular, high-quality thermal imagery acquisition depends on sensor characteristics (e.g., spectral range, thermal resolution), atmospheric correction protocols, and proper calibration (emissivity, ambient conditions). Main processing typically involves:
- Radiometric Correction: Converts raw digital values to radiance and temperature, considering sensor calibration and atmospheric attenuation.
- Emissivity Adjustment: Surface emissivity (ε) is crucial—vegetation and water ~0.98, concrete ~0.94, metal surfaces lower and variable.
- Georeferencing and Orthorectification: Aligns thermal data with physical locations and corrects distortions due to sensor angle or topography.
- Integration with GIS and 3D models: Enables thermal overlays on urban morphology and topography.
Thermographic data supports and complements simulation tools as summarized in the following Table:
| Tool/Platform | Function | Scale |
| FLIR Tools | Thermal image capture and analysis | Ground/Drone |
| Landsat 8–9 TIRS/Sentinel-3 | LST retrieval at 100m/1km resolution | City-region |
| SatVU | LST retrieval at 3m resolution | City/Neighborhood |
| UAV with TIR cameras | Flexible, high-resolution thermal mapping | Neighborhood |
| ENVI/SNAP | Remote sensing processing (LST retrieval) | Regional |
| UMEP+SOLWEIG | LST and Thermal comfort modeling | Urban |
MAIN APPLICATIONS

Thermographic imagery enables targeted interventions and strategic planning to enhance urban thermal resilience. Key applications include:
- Building Energy Audits: Identifies insulation defects, thermal bridging, and HVAC inefficiencies to enhance energy performance.
- Urban Heat Island UHI Mitigation Planning: Identifies surface temperature hotspots to prioritize cooling interventions such as reflective roofs, permeable pavements, and increased vegetation.
- Infrastructure Monitoring: Detects overheating in electrical systems, pipelines, and transportation networks.
- Thermal Comfort Design: Evaluates surface temperatures in plazas, parks, and streetscapes to optimize shading and material selection.
- Vegetation Health Assessment: Monitors plant stress via canopy temperature for urban forestry management.
- Disaster Response: Locates heat sources during fires or power outages using aerial thermography.
- Climate Resilience: Tracks temperature trends to assess adaptation strategies under climate change scenarios.
- Public Health Interventions: Maps heat exposure in vulnerable neighborhoods to guide heat-action plans and cooling centers.
- Historical Preservation: Detects moisture intrusion and thermal degradation in heritage buildings.
- Educational Outreach: Facilitates visual storytelling and data-driven planning through community-led heat mapping and interactive thermal displays.
RELATED LINKS AND ADDITIONAL RESOURCES
- FLIR – Handheld Thermal Cameras: Offers a wide range of portable thermal imaging devices used for building diagnostics, infrastructure inspection, and energy audits. FLIR tools are industry-standard for ground-based thermographic surveys.
- ECOSTRESS – Surface Temperature and Water Stress Instrument: A thermal infrared radiometer onboard the International Space Station measuring land surface temperature and evapotranspiration at high resolution, aiding in urban heat monitoring and vegetation stress detection.
- Satellite Vu – High-Resolution Thermal Imaging from Space: Delivers unprecedented thermal imagery from orbit (3.5–5 m resolution), enabling fine-scale analysis of building-level heat signatures and global thermal emissions with frequent revisits.
- Landsat – Thermal Infrared Sensors for Earth Observation: NASA’s long-running satellite program provides global thermal imagery (TIRS) used to analyze land surface temperature trends, urban heat islands, and environmental change since the 1980s.
- Copernicus Sentinel-3 – Sea and Land Surface Temperature Monitoring: Equipped with the SLSTR sensor, Sentinel-3 offers medium-resolution thermal data for continuous monitoring of surface temperatures over land and water, useful for climate and urban heat analysis.
*Images from

